
Usage
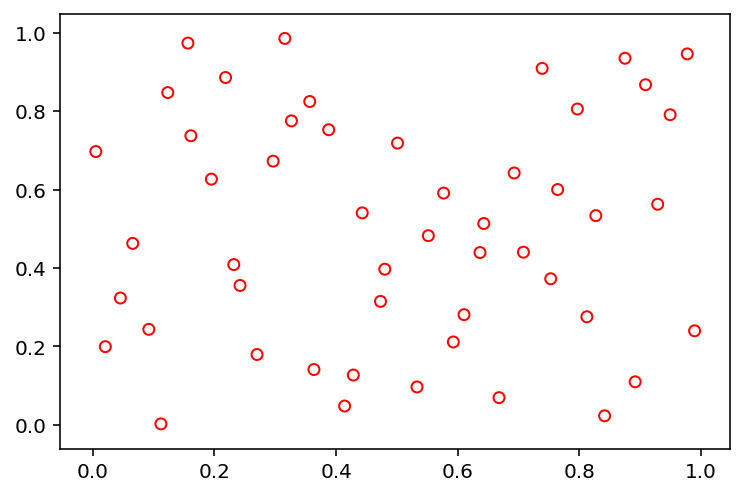
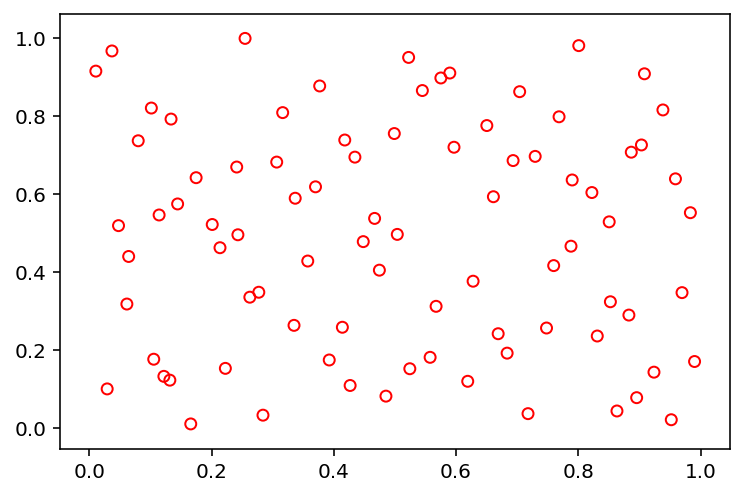
The method to be used for sampling using different algorithm must be import from pysampling.sample. Here, we use Latin Hypercube Sampling to generate 50 points in 2 dimensions.
[1]:
from pysampling.sample import sample

X = sample("lhs", 50, 2)
Then, we recommend using matpotlib or other visualization libraries to have a look at the results:
[2]:
import matplotlib.pyplot as plt

plt.scatter(X[:, 0], X[:, 1], s=30, facecolors='none', edgecolors='r')
plt.show()
Features
So far our library provides the following implementations:
Random (‘random’)
Latin Hypercube Sampling (‘lhs’)
Sobol (‘sobol’)
Halton (‘halton’)
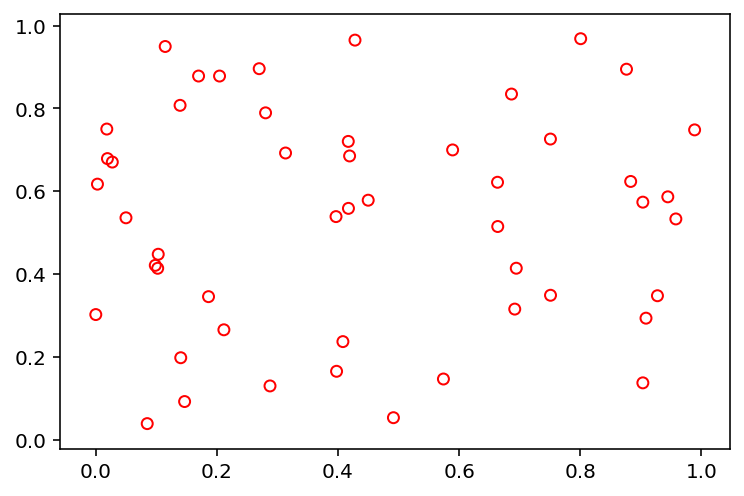
The initialization of each of those will be shown in the following. Let us first define a method that helps us to visualize them in a 2d space.
[3]:
import matplotlib.pyplot as plt

def show(X):
    plt.scatter(X[:, 0], X[:, 1], s=30, facecolors='none', edgecolors='r')
    plt.show()
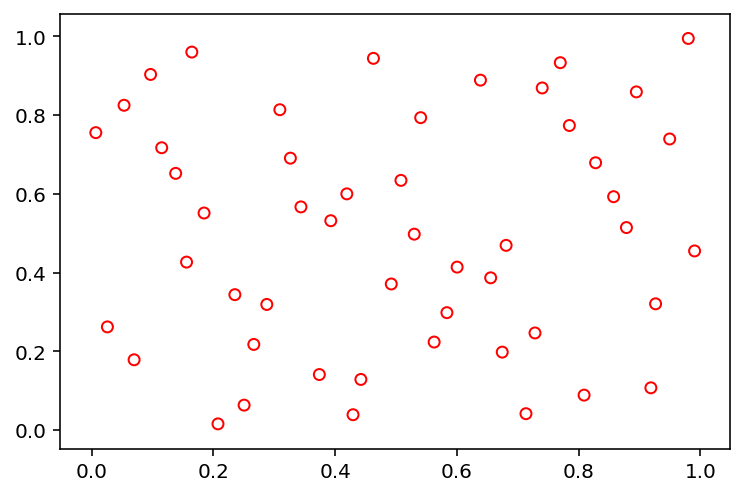
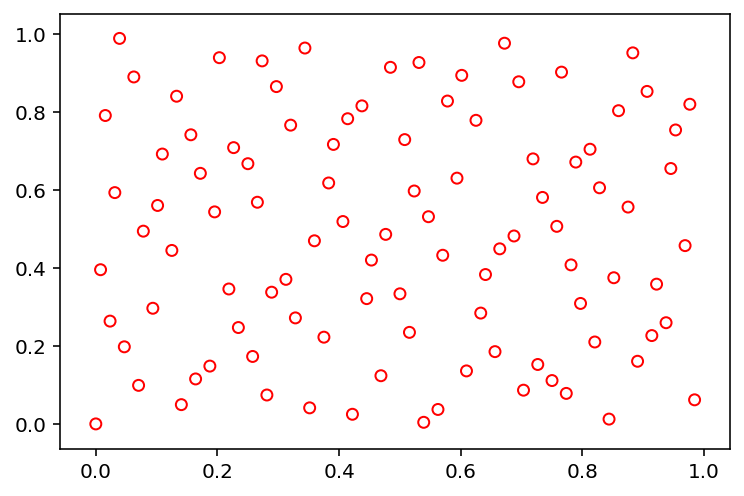
Sobol (‘sobol’)
[6]:
X = sample("sobol", 84, 2)
show(X)
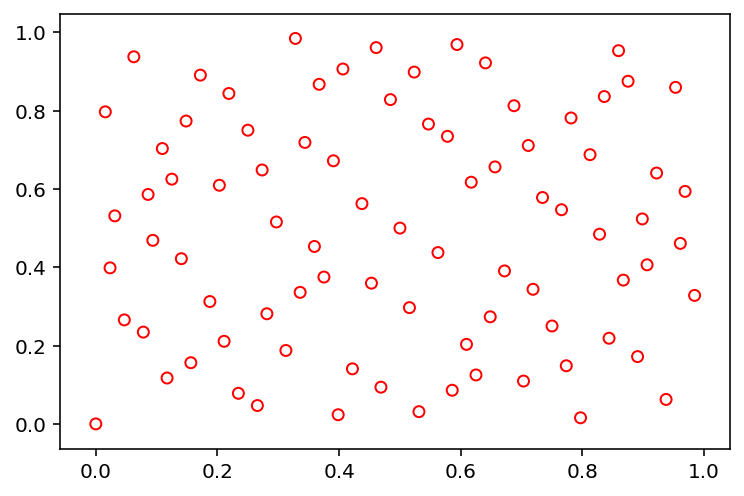
[7]:
X = sample("sobol", 84, 2, n_skip=100, n_leap=10)
show(X)
Contact
Feel free to contact me if you have any question:
Julian Blank (blankjul [at] egr.msu.edu)
Michigan State University
Computational Optimization and Innovation Laboratory (COIN)
East Lansing, MI 48824, USA